Microsoft Power BI
Visualise how your business is performing and make smarter decisions for promoting growth and sales while reducing unnecessary costs
-
Power BI is a BI tool from Microsoft used to create interactive reports.
-
We have adopted best practice when it comes to Power BI implementation.
-
Copilot has landed. Discover how it can enable fast insights.
-
We understand that no two data journeys are the same.
What is Power BI?
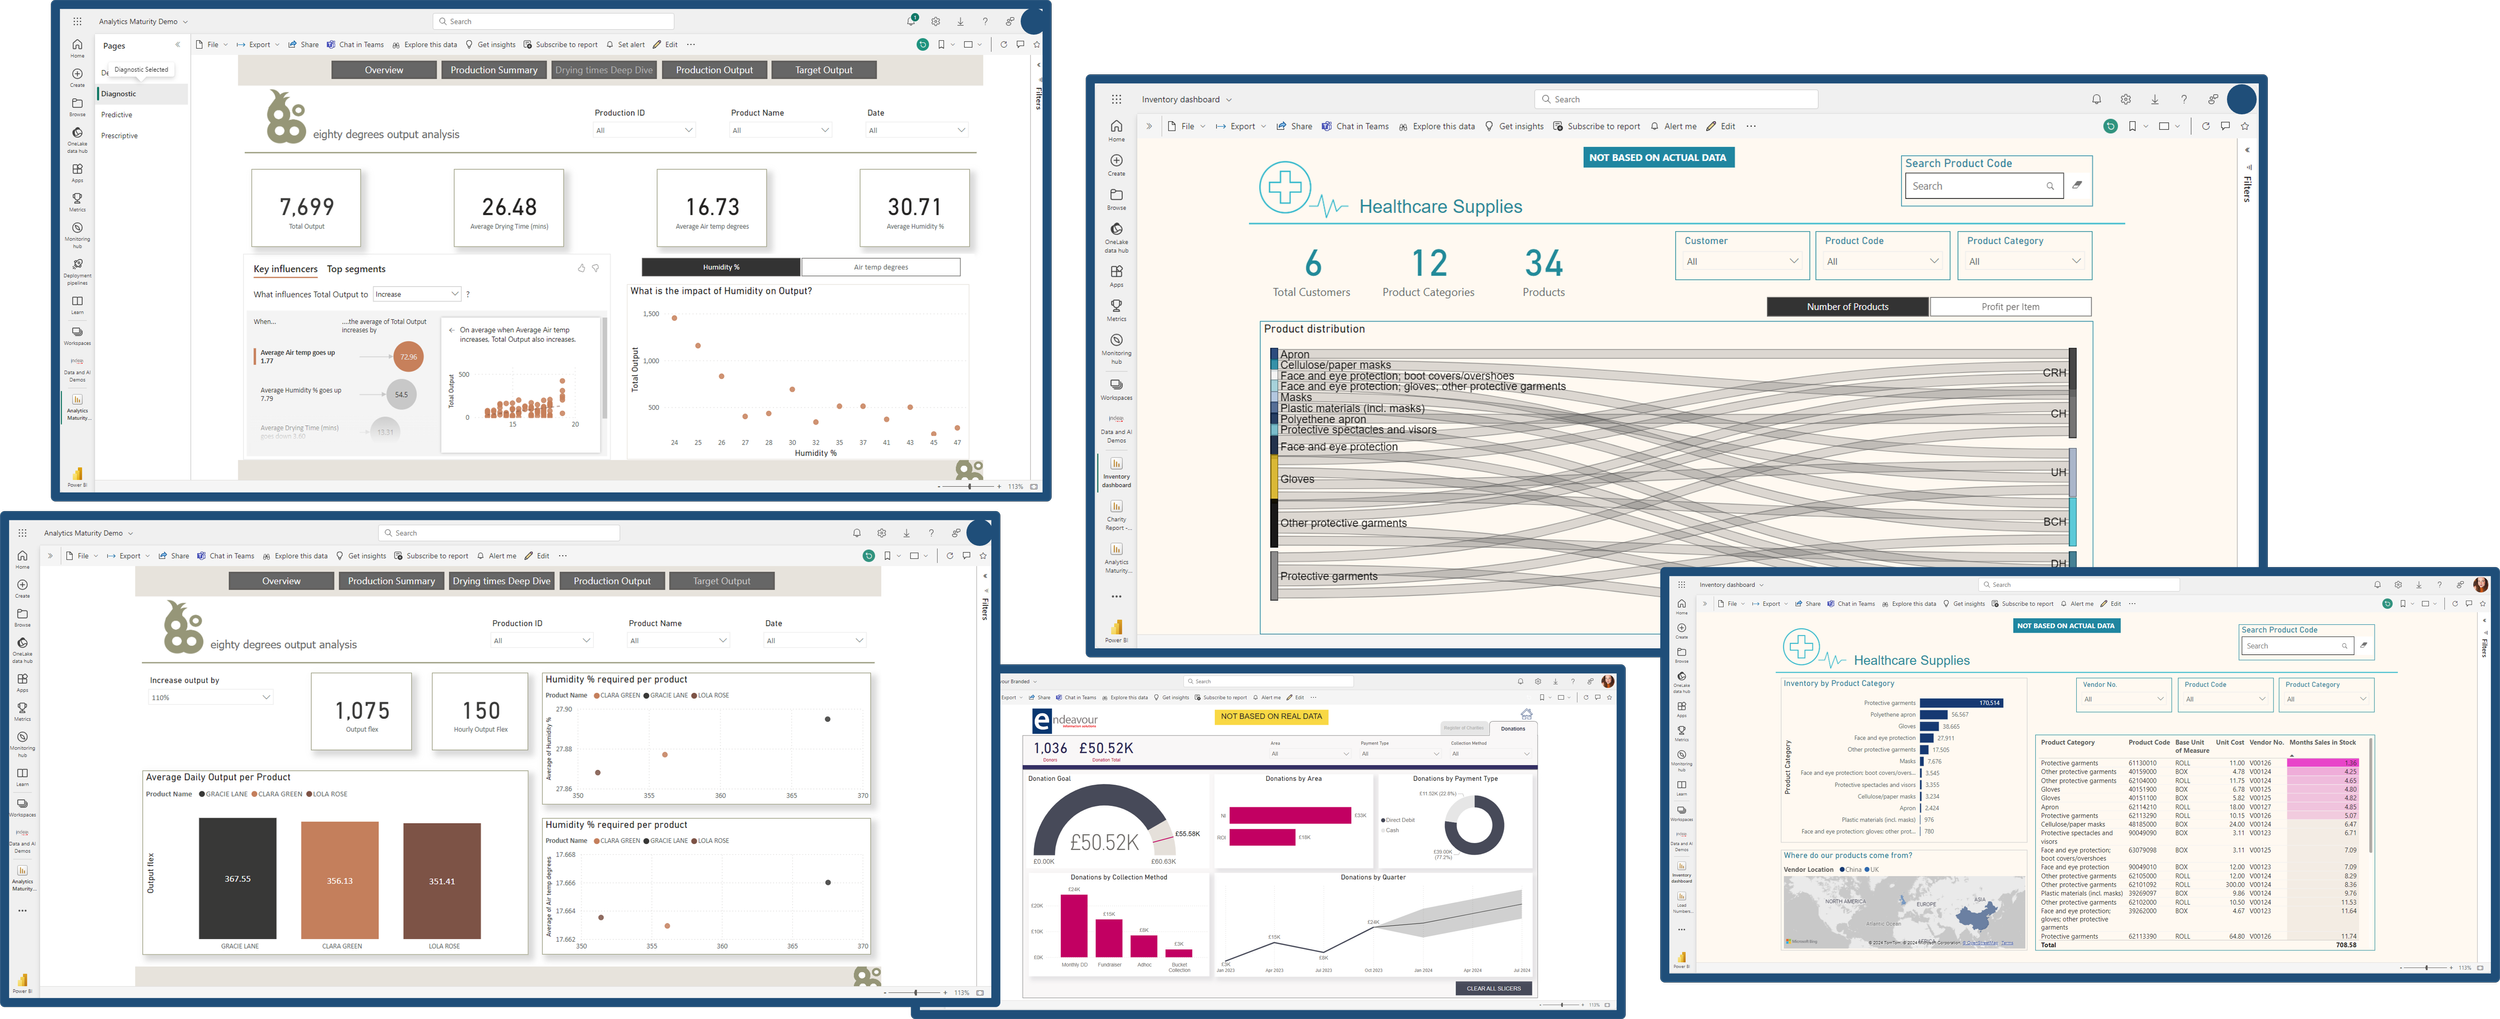
For any business, the volume of data associated with every process increases over time to the point where it becomes difficult to discover the information that will ultimately allow for growth. In order to get meaningful insights from this data, it is vital to display what really matters by collating relevant information and linking it to see trends. This is where the platform of Microsoft Power BI is able to provide structured visuals in the form of dashboards and reports that allow you to see what you need to and use business analytics to make a difference.
Microsoft Power BI dashboards are available on the Mobile App, Online, Desktop version, and as part of the Microsoft Fabric package, so that you can see in premise or cloud data in real-time, wherever you are. These reports are interactive and customisable, allowing for filtering at the click of a button using sliders and insights can be shared with other users for collaboration. Natural language queries are enabled on the dashboards, enabling the user to get richer insights through dashboard commentary.
Although Power BI functions as a standalone product, it has hundreds of connectors and can work in Conjunction with numerous products, such as Dynamics 365, Microsoft Teams, SharePoint to give your business insights and opportunities to both new and existing customers.
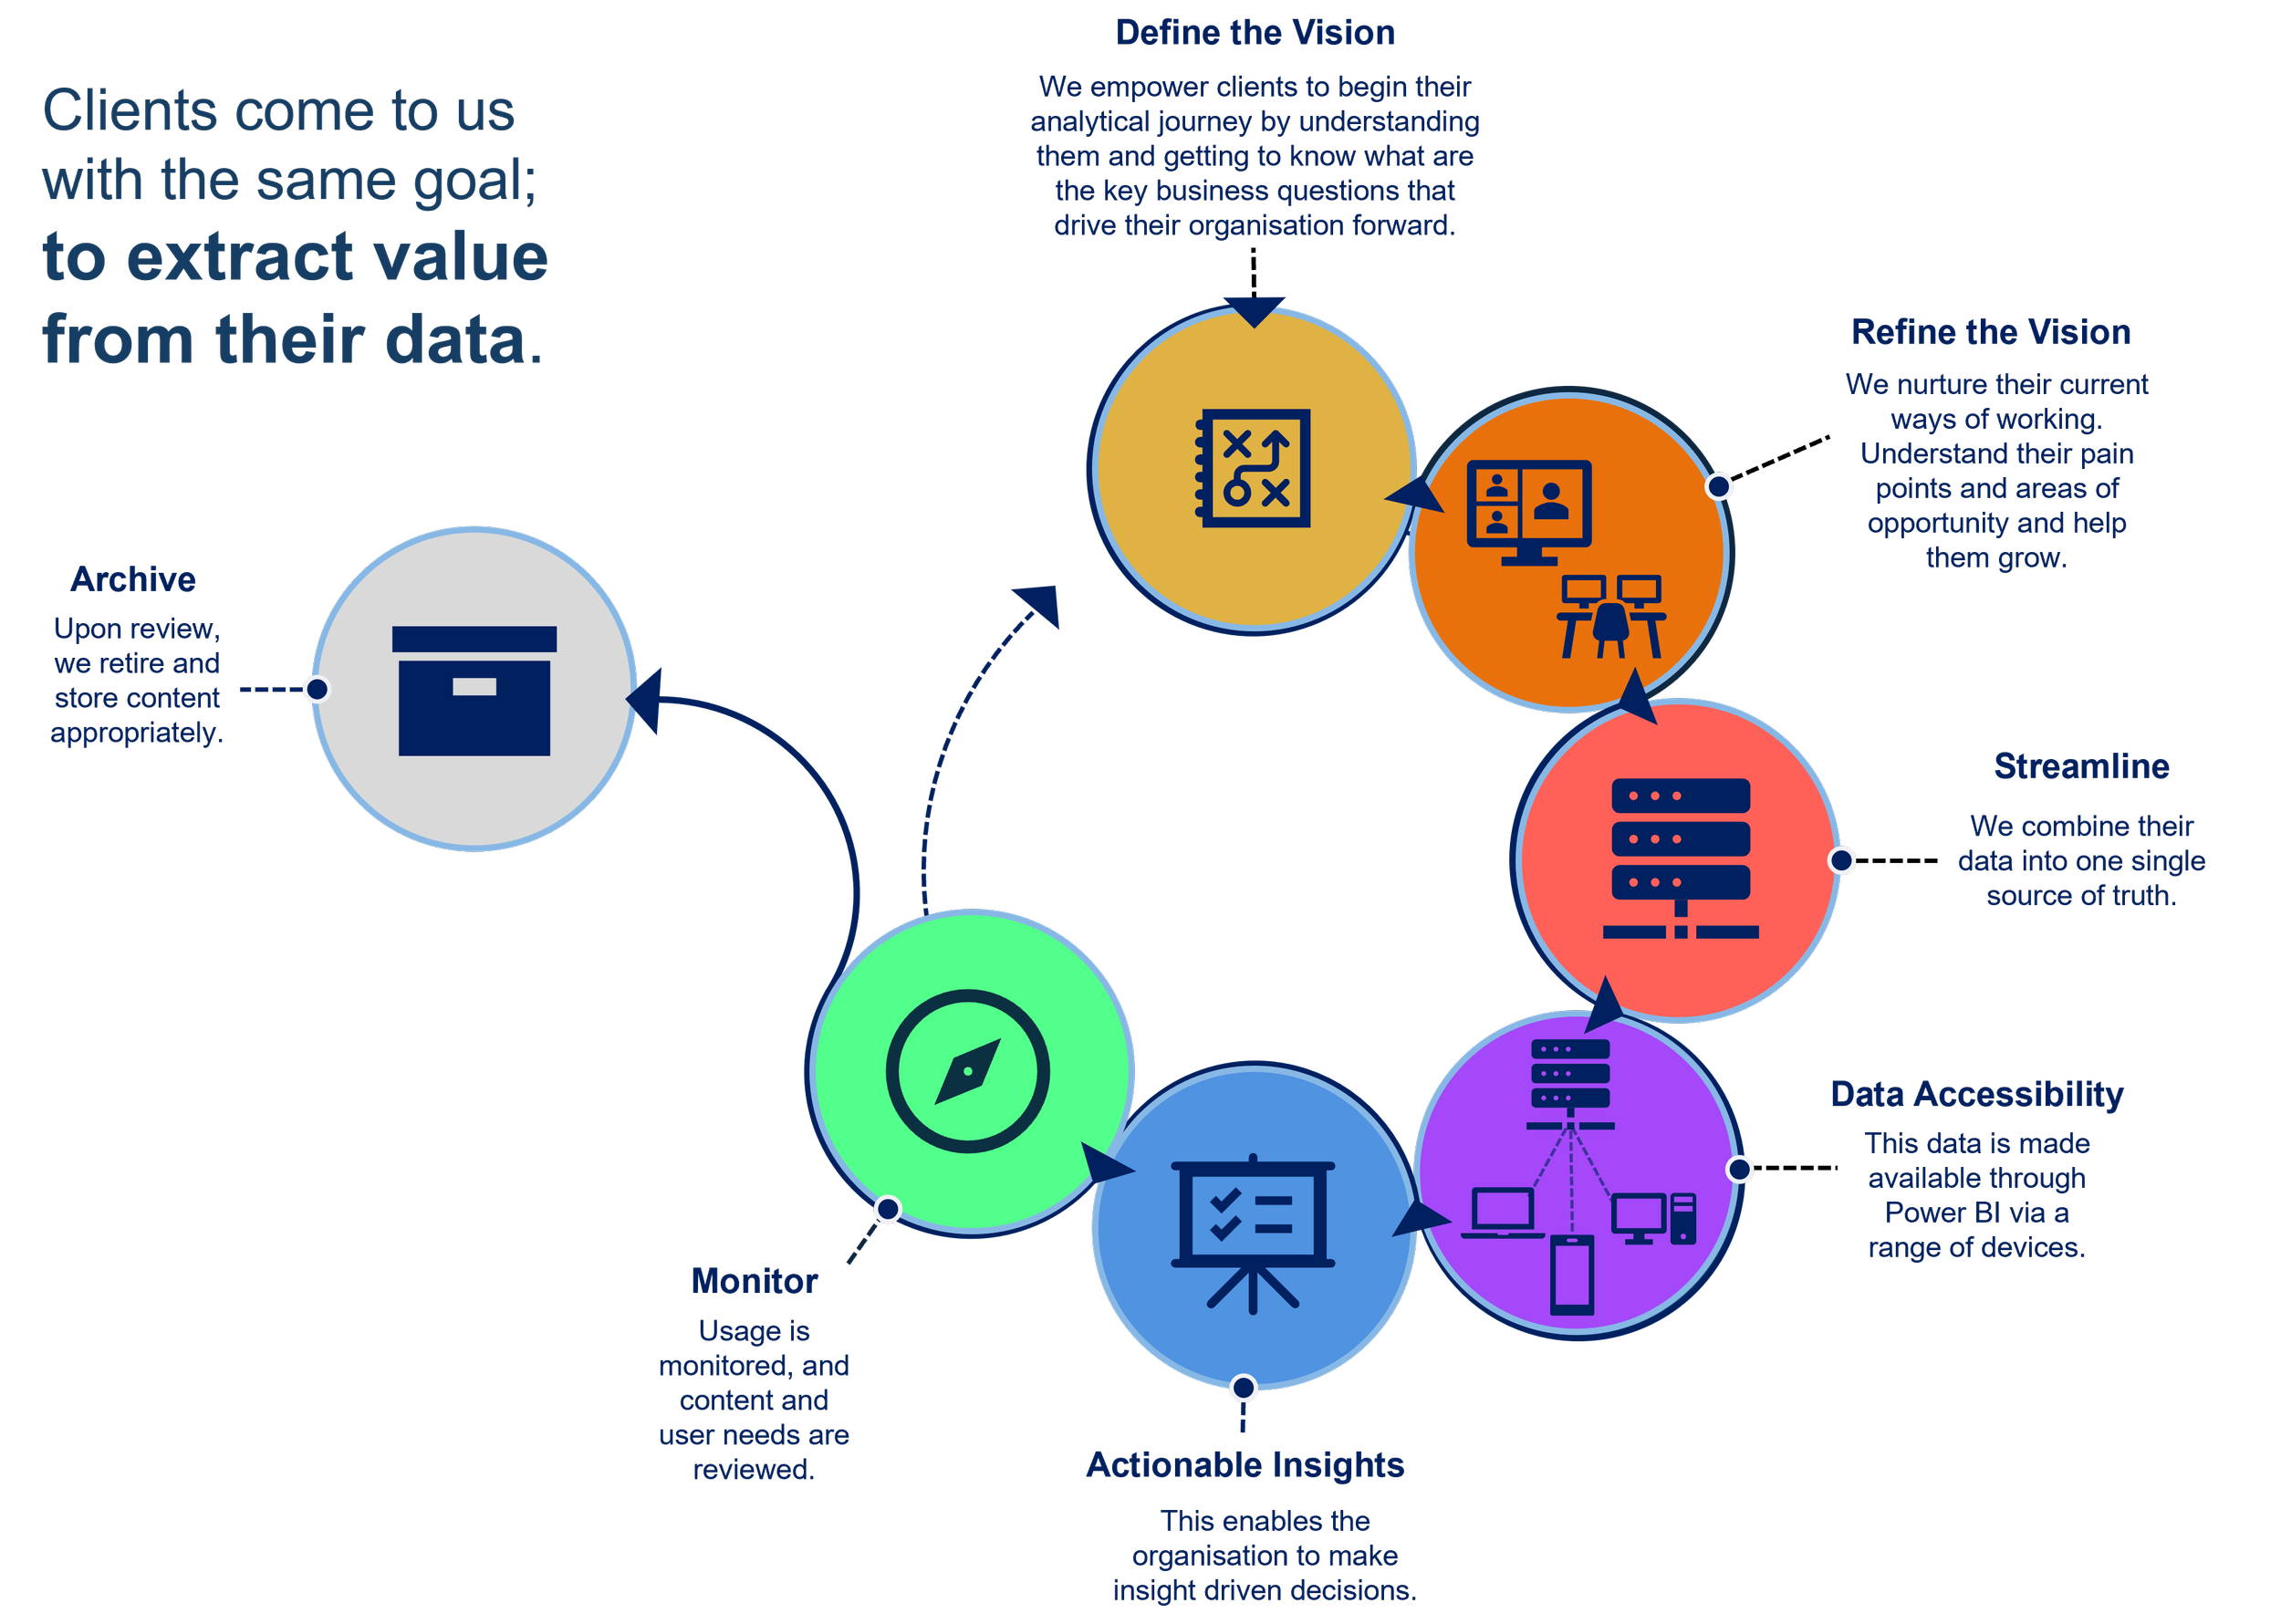
The Power BI Delivery Lifecycle
Power BI and Copilot
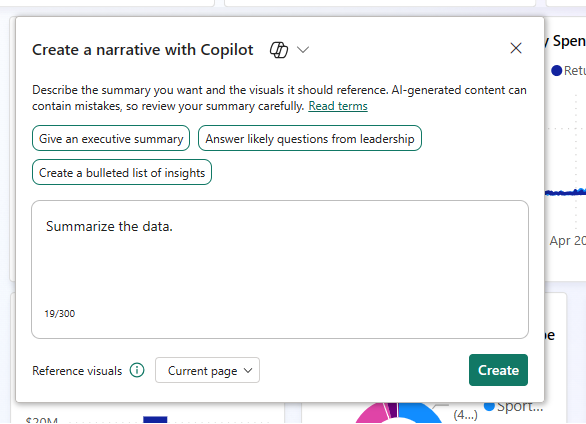
Copilot in Power BI allows you to create report pages using simple commands such as ‘Show me sales for this quarter’ in both Power BI Service and Power BI desktop.
Copilot will analyse your semantic model and make suggestions for reports. For example; ‘Create a page to compare this quarter’s sales to last quarter’s sales’. Copilot will deliver several suggestions for the user to select and begin creating report pages.
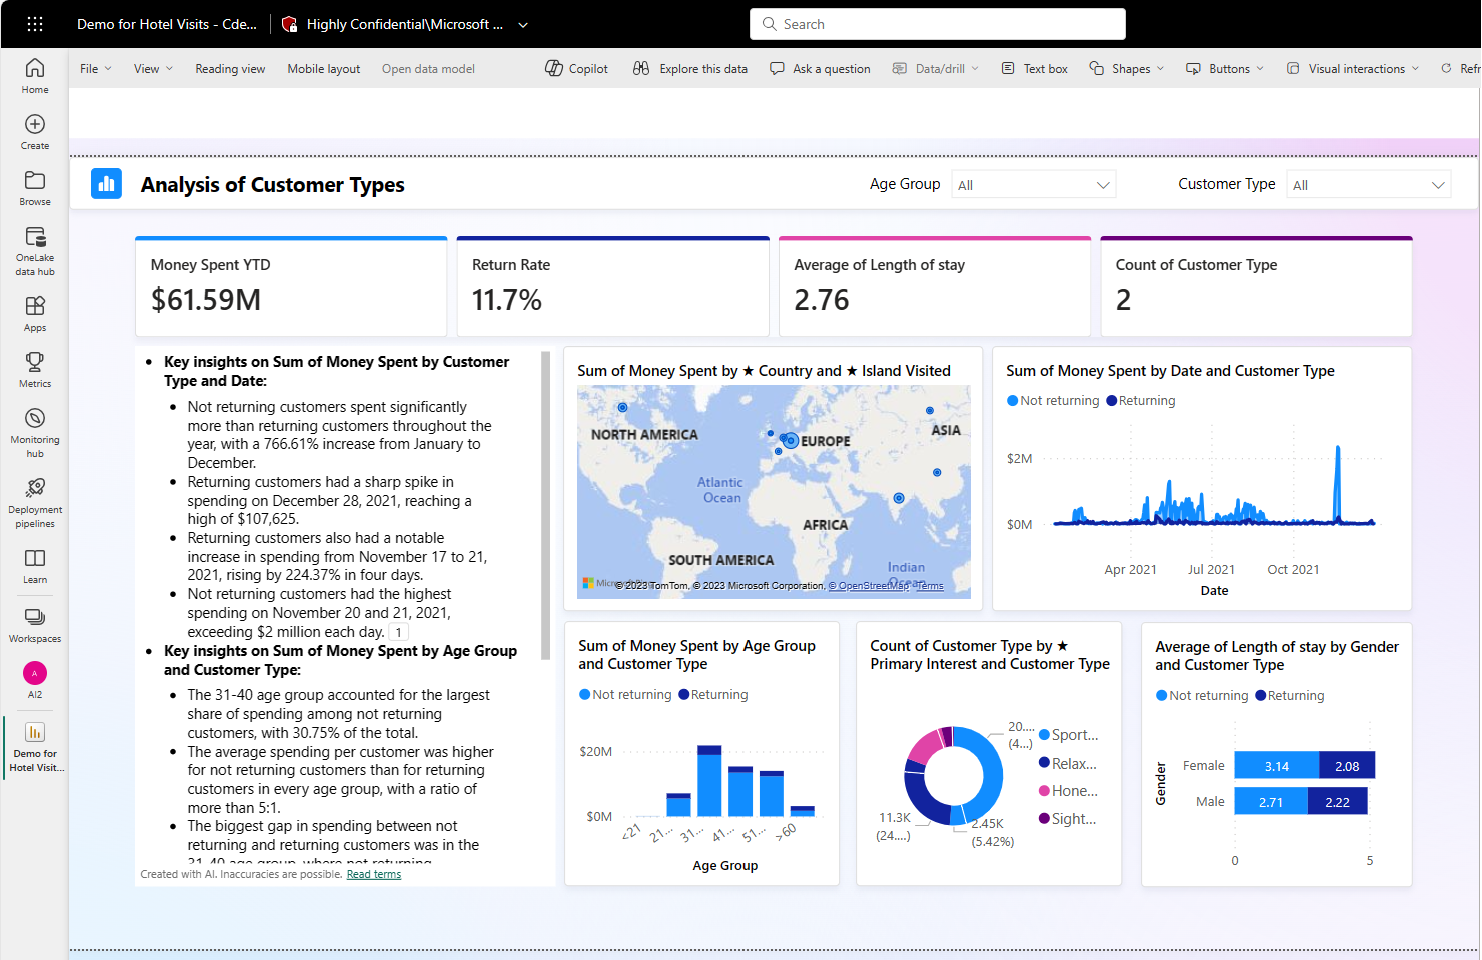
Users can also create commentary on their reports by using Copilot’s ‘Create a narrative summary visual’ feature, which provides a narrative of individual visuals, or entire reports.
Images from: Microsoft Learn
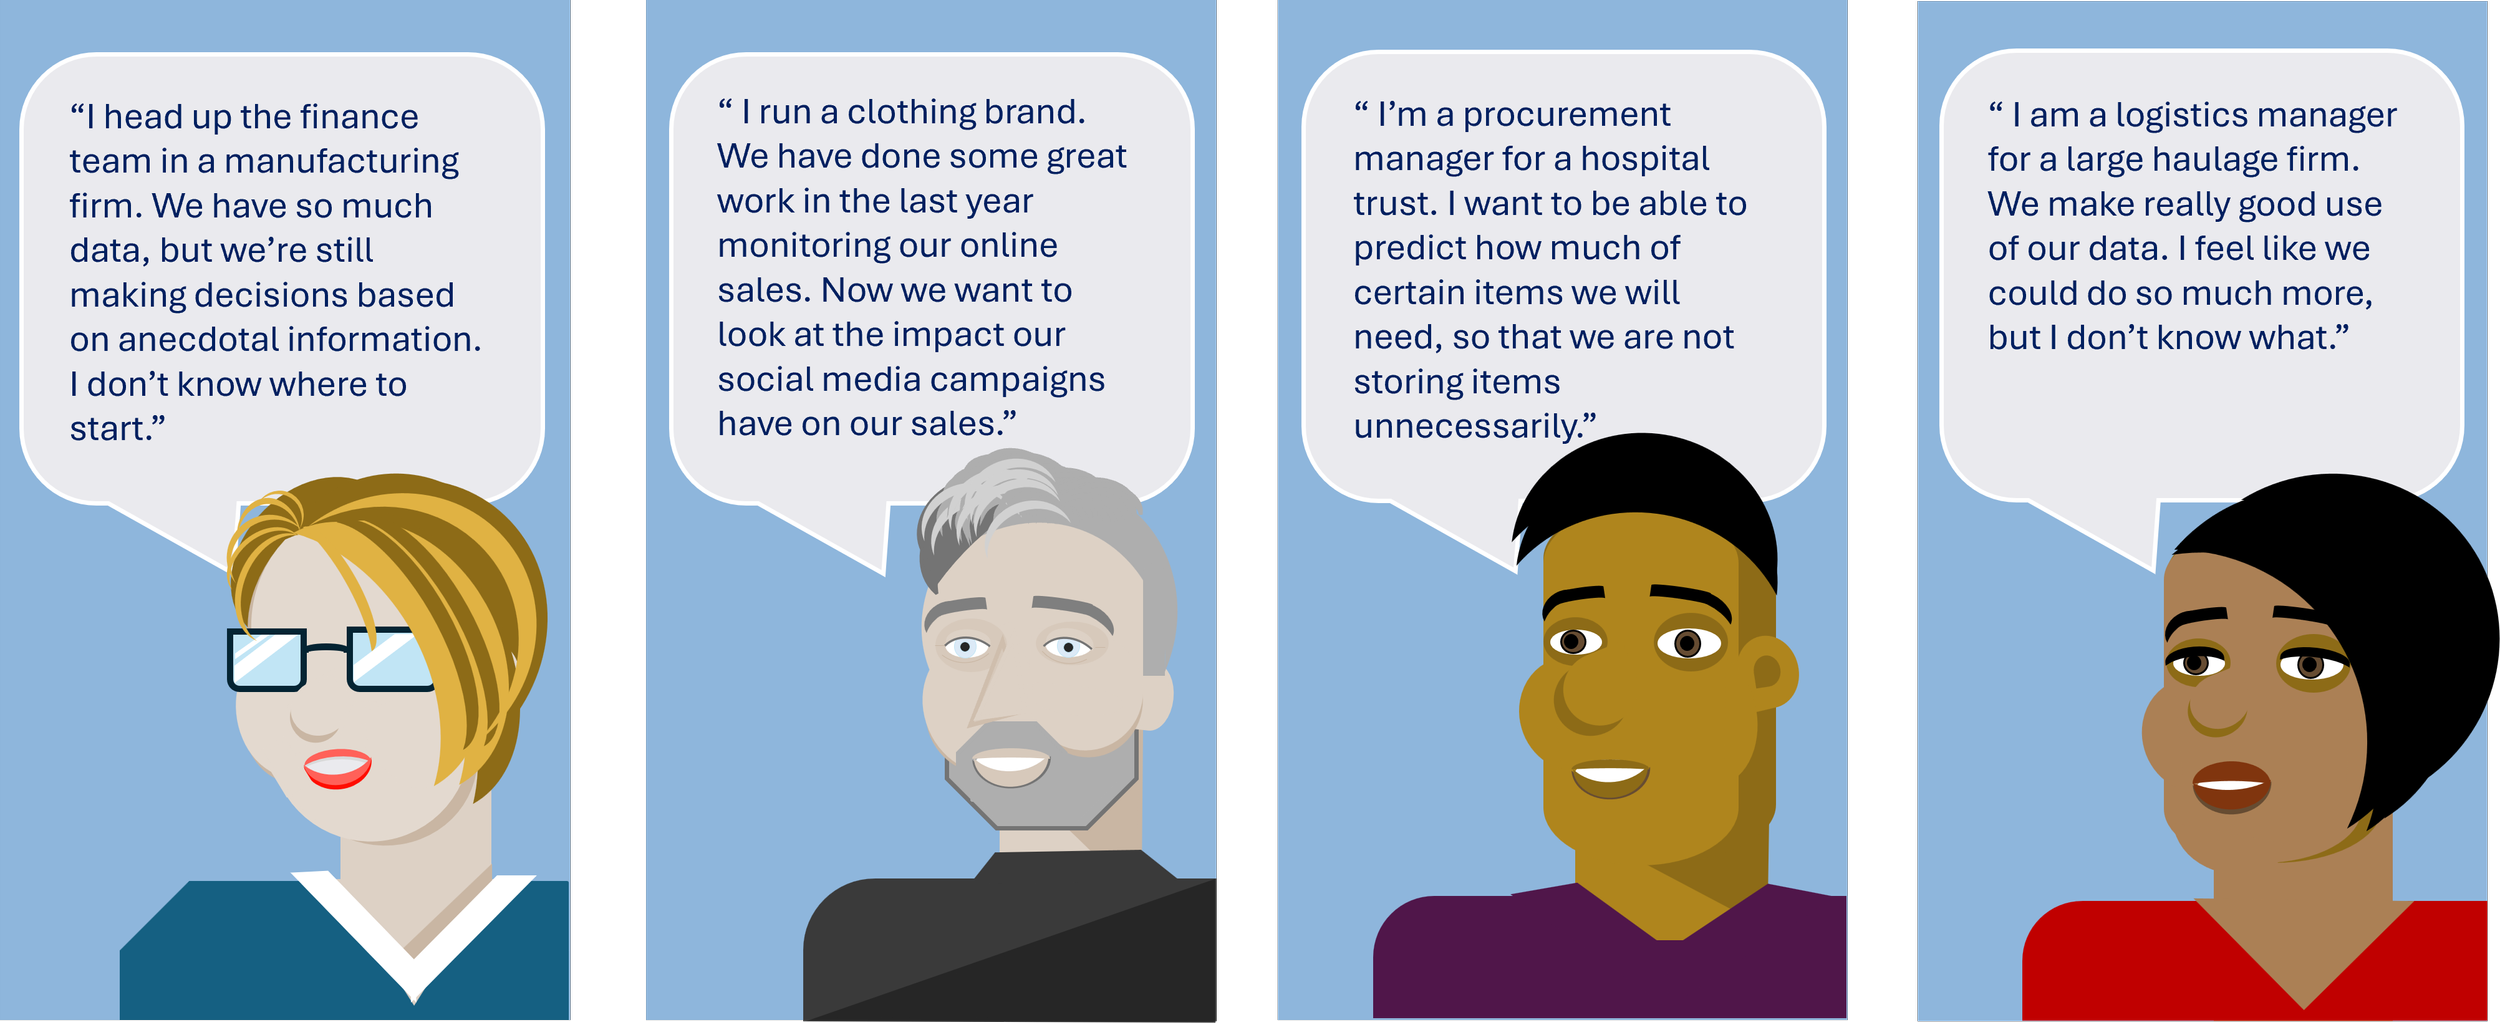
Clients come to us at various stages of their Analytics Journey
Find out more about becoming insight driven, by reading our Article Series on the Analytics Maturity Model.
Why Choose Endeavour?
Endeavour are a Microsoft Solutions partner that specialises in delivering Microsoft Cloud based projects to its customers. We have a wide range of clients in different sectors with user bases from several to thousands of end users.
Our team are all Microsoft certified to the latest versions of Office 365, Microsoft Azure and solution software development for both on premise and cloud based platforms.
Contact us anytime for a free consultation
If you would like to speak with someone about how Microsoft Power BI as part of the Microsoft Power Platform could help improve your team’s productivity and grow your business please use the Contact Us form or call us at either our Belfast office on 028 9031 1010, Edinburgh office on 0131 376 0090 or London office on 020 4591 4545 and see where we can help you take your business.
